RadarLab X Help Guide
Custom Lines
Add the Latitude and Longitude points that make up your lines in the text box on the Custom Lines editor. Each latitude and Longitude point must be in degrees, decimal degrees and separated by commas. Longitude points must have a negative sign in front of them.
Example: “32.6745,-94.3587”
You can define more than one line. The points that make up a line must be written on the same line in the text box. So if you want two line segments, you will have two lines of points in the text box. Here is an example of two lines.
Map Overlays
World Boundaries
Country Boundaries
City Labels
County Names
GPS Location
Custom Locations
Custom Lines
Interstates
Places Map
Note to RadarLab Local users
Tools
Pan/zoom
Interrogate
Mouse measure mode
Draw mode
Weather Overlays
Accessible in the top-left corner of the screen (the ‘ Overlays’ menu), many weather data overlays may be plotted on the map. Some layers may feature a slider used for controlling opacity, as well as a drop-down menu for customizing the display.
Radar
Toggles radar visibility. Note that this doesn’t load or unload radar data by itself.
Satellite
Displays either visible, infrared, or enhanced infrared GOES-16 satellite data based on your preference. This data is updated every 5-10 minutes.
Storm tracks
Displays the storm tracks on the map. The storm tracks are color coded depending on severity. The user can define the color and size of the storm tracks. Clicking on the storm track will show all the attributes associated with that storm track and a storm path estimate.
You may also display the “storm attributes table”, providing more detailed information as well as options for filtering storm tracks based on TVS, MESO, top dBZ and top VIL.
Local Storm Reports
Displays Local Storm Reports issued by the NWS. These are reports of weather phenomena or damage caused by severe weather events. They are reported by trained spotters, law enforcement, EMA and other personnel.
SpotterNetwork
Displays information provided by the [SpotterNetwork](https://www.spotternetwork.org/). These are reports issued by trained weather spotters and are similar to the Local Storm Reports issued by the NWS.
Current Temps
Displays the current temperatures on the map. This information comes from data issued by METAR reporting stations. Dew point temperature may be displayed in place of this as well.
Wind Barbs
Displays wind barbs next to temperatures. Clicking on wind barbs or temperatures will display surface observations from the hovered station.
Watches, Warnings, & Advisories
NWS watches, warnings, and advisories (WWAs) may be displayed. You can filter various WWA types.
Mesoscale Discussions
When conditions begin to shape up for severe weather, the SPC (Storm Prediction Center) often issues a Mesoscale Discussion (MCD) statement anywhere from roughly half an hour to several hours before issuing a weather watch. This information may be displayed similar to WWAs.
Severe Weather Outlook
Enabling this will display the latest SPC day 1 convective outlook mosaic.
Workspaces
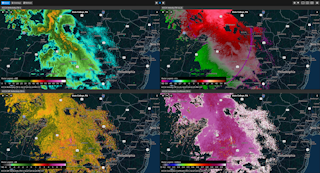
New in RadarLab X, you may display radar data in either a single-pane display (standard), or dual-/quad-pane displays we call “workspaces”. Workspaces display various radar products, including products from different radar sites.

To set up a workspace, use the menu in the top-right and navigate to Settings > Default Settings > Workspaces.
